Full disclosure...I have been doing a lot of fishing with my friends and spending time with family. This was necessary because I was getting crabby for no reason. I'm feeling much better thanks, again, to my friends and family members.
Now, on to graphing...
I subscribe to the PowerShell Power Users group on LinkedIn. Looking at the latest articles, I found an article by Kevin Marquette called "Graph All Things! with PSGraph and GraphViz" (https://www.linkedin.com/groups/140856/140856-6232213168123453443). This is pretty cool.
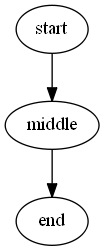
NOTE: using PSGraph is not like graphing in Excel. This are simple graphs that can be used for some complex solutions. For example, here is a simple graph:

graph basic {
edge -From start -To middle
edge -From middle -To end
}
Here is a sample of a complex graph:
} | Export-PSGraph -ShowGraph

graph finite_state_machine @{rankdir='LR';size=8.5} {
node LR_0,LR_3,LR_4,LR_8 @{shape='doublecircle'}
node @{shape = 'circle'}
edge LR_0 LR_2 @{ label = "SS(B)" }
edge LR_0 LR_1 @{ label = "SS(S)" }
edge LR_1 LR_3 @{ label = 'S($end)' }
edge LR_2 LR_6 @{ label = "SS(b)" }
edge LR_2 LR_5 @{ label = "SS(a)" }
edge LR_2 LR_4 @{ label = "S(A)" }
edge LR_5 LR_7 @{ label = "S(b)" }
edge LR_5 LR_5 @{ label = "S(a)" }
edge LR_6 LR_6 @{ label = "S(b)" }
edge LR_6 LR_5 @{ label = "S(a)" }
edge LR_7 LR_8 @{ label = "S(b)" }
edge LR_7 LR_5 @{ label = "S(a)" }
edge LR_8 LR_6 @{ label = "S(b)" }
edge LR_8 LR_5 @{ label = "S(a)" }
} | Export-PSGraph -ShowGraph
I can use PSGraph to give high level views of how some of our processes are working. I can see using this for network diagrams and flow charting.
My next post will be on different scripting environments (ISE, ISESteroids, Powershell Plus, etc.) Stay tuned.
No comments:
Post a Comment